Graphs and Time
The Active, Completed, or Canceled Plan Dashboard allows you to see the progress or result of a plan. Also, you can see how long the plan has been in progress or did it take to complete. Please refer to Active Plans, Completed Plans, or Canceled Plans
to learn how to navigate to each area.
Graphs

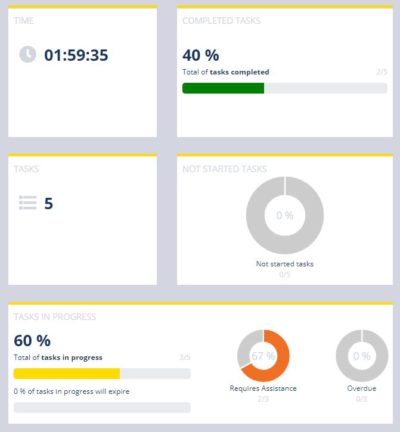
- Completed tasks progress bar shows the percentage and quantity of active tasks that have been completed.
- Not started tasks graph shows the percentage and quantity of active tasks that are yet to be started.
- Tasks in progress bar shows the percentage and quantity of active tasks that have been started.
- Tasks in progress will expire bar shows the percentage and quantity of tasks that have a remaining time of less than a quarter of the completion time.
- Require assistance graph shows the percentage and quantity of tasks in progress that users or supervisors need assistance with.
- Overdue graph shows the percentage and quantity of tasks in progress that have exceeded the completion time.
Time
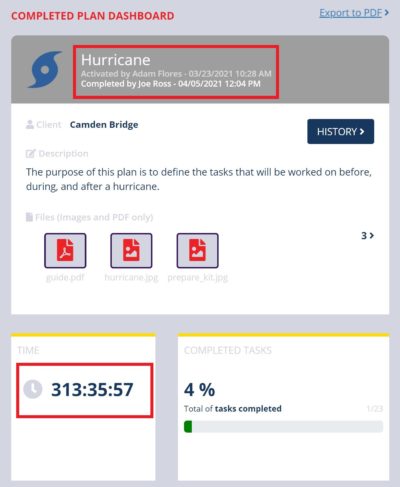
The Time section can indicate how long the plan has been in progress or the time it took to complete.

- Timestamps indicate when a plan is activated, completed, or canceled.